The World of Analytics
A perfect amalgamation of management, business, and computer science is evolved as an avenue known as Business analytics. Not that before computer science, this avenue didn’t exist, but computer science has automated and advanced this field and is helping organizations to get better insights about their business, customers, geographies, etc. It is also helping business firms to predict the future and make more accurate & informed business decisions in their respective domains.
The field of business analytics involved the three most essential components — big data, statistics analysis, and data visualization.
Big data — In current modern society, any organization is valued based on the data that is has collected over the past years from its business. This data includes information about the customers, sales, purchases, seasonality, geography/location data, revenues, profits, inventory, and other key metrics. Since, in this competitive world of business, every organization from small/mid-sized to multi-national organizations are investing their efforts, time & resources to collect data which would help them to make more accurate business decisions in their respective fields. The more data they have, the more competitive advantage they will have in the market.
Statistical analysis — The raw data that is collected over a period of time from different sources is cleaned and transformed and fed in statistical models to analyze the trend and predict the future. This process is of learning from the past data using statistical models to predict the future is known as predictive analytics. The application of different mathematical & statistical techniques in the large dataset (i.e., big data) to find out correlations, patterns, and trends is called data mining. This analysis helps organizations to make more accurate predictions & recommendations and ultimately improve businesses.
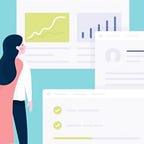
Data visualization — After the step of collecting the data and doing the analysis on it, we have to represent it graphically to different stakeholders in the business. These stakeholders can be executives, business leaders, and other personnel working in an organization, who need the representation of the data to visualize & make informed business decisions. There are various tools available in the market to do data visualization. Both open-source and licensed products are available in the market. It depends on the many factors to choose the right kind of tool, some of them are — financial cost, time to understand the tool, complexity of the data, and usability (ease of use). There are programming languages like R, a python that has modeling & visualization support. On the other hand, there are graphical user-supported visualization tools that don’t require programming expertise but are generally licensed, some of them are — Tableau, Qlick, Sisense & SAP.
When we talk about business analytics, it is differentiated into three categories:
Descriptive Analytics — It is referred to as “insights from past.” Descriptive analytics is a process of collecting, analyzing the past data to make judgments about the patterns followed by recent data. Data aggregation and data mining are core components that help organize the data and identify trends. It helps answer the question, “What has happened?” in the past.
Predictive Analytics — It is referred to as “Understanding the future.” Predictive analytics is the foundation of predicting what might happen in the future. It provides insights about a future predictions for organizations based on past data. Predictive analytics predicts the possibility of the future by using data, statistical models, and machine learning techniques based on past behaviors or data. Data mining, text analytics, along with statistics, permits business users to create predictive intelligence model by analyzing patterns and relationships in both structured and unstructured data. It helps organizations to become forward-looking and proactive.
Prescriptive Analytics — It is referred to as “Advice on possible outcomes.” Prescriptive analytics is a field of analytics in which the best course of action and solutions are decided based on descriptive and predictive analytics. It can help mitigate future risk by suggesting the analytical work and illustrate the implications of each decision option.
I have listed a few products and services which we come across in daily routine and are entirely based on Analytics–
LinkedIn — LinkedIn is the largest social platform for professionals to connect, with 400 million profiles and two new members joining the network every second. LinkedIn Big data Analytics is the reason behind the massive success of the organization. It uses user data for its recommendation engine to build various products and services. Data from the user profile and various network activities are used to create a comprehensive model. LinkedIn knows who you should connect with, where you should apply for a job and how your skills stack up against your peers as you look for your dream job. Few successful product analytics at LinkedIn are — “People You May Know,” “Skill endorsements,” “Jobs you may be interested in,” and “News Feed updates.”
Netflix — Netflix is the most valued media company; it uses big data analytics to attract and retain customers. Netflix uses analytics by collecting data from 150 million subscribers and implementing data analytics models to discover customer behavior and buying patterns. Then, using that information to recommend movies and TV shows based on their subscribers’ preferences. It collects customer interaction and response data to a TV show. According to Netflix, they earn over a billion in customer retention because the recommendation system accounts for over 80% of the content streamed on the platform. Netflix also uses its big data and analytics tools to decide if they want to greenlight original content.
Starbucks — Starbucks uses business analytics in reaching out to customers and monitoring their daily coffee preferences. They have launched reward programs and mobile apps to provide premium services to customers as well as capture data to improve the business model. The mobile app has more than 17 million, and the reward program has 13 million active users. These users alone create an overwhelming amount of data about what, where, and when they buy coffee and complementary products that can be overlaid on other data, including weather, holidays, and special promotions. This data collection and analysis have helped Starbucks decide the location of prospective stores as well as potential customers.
References –
https://www.dezyre.com/article/how-linkedin-uses-hadoop-to-leverage-big-data-analytics/229
https://www.investopedia.com/terms/p/prescriptive-analytics.asp